Measure commit-to-verdict time before tuning your GitHub Actions workflow
Split queue wait from run time to find which fix actually helps.
Sponsored by Graphide
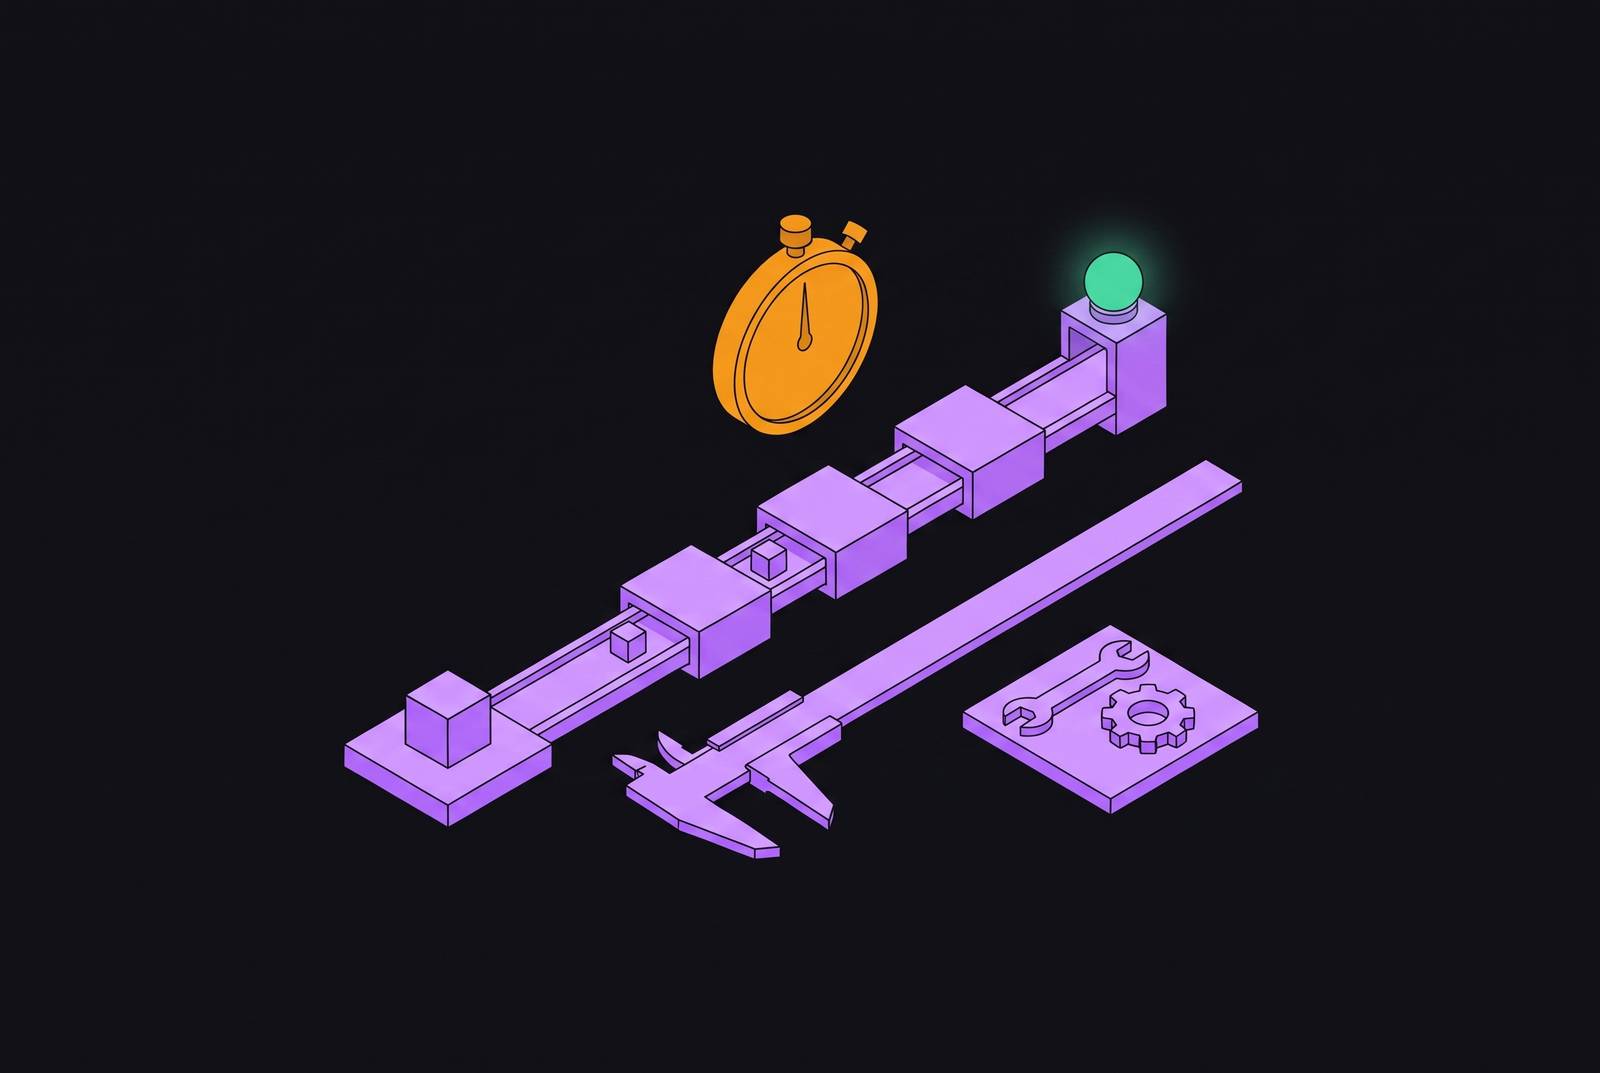
Commit-to-verdict time in GitHub Actions needs to be measured before it can be improved. Engineering leads must separate queue wait from execution duration, because runner capacity and build efficiency demand different fixes. A sound baseline shows which fix can shorten feedback and keeps teams from spending on the wrong layer, and its value grows as coding agents keep pressure on CI.
Why commit-to-verdict time is two numbers, not one
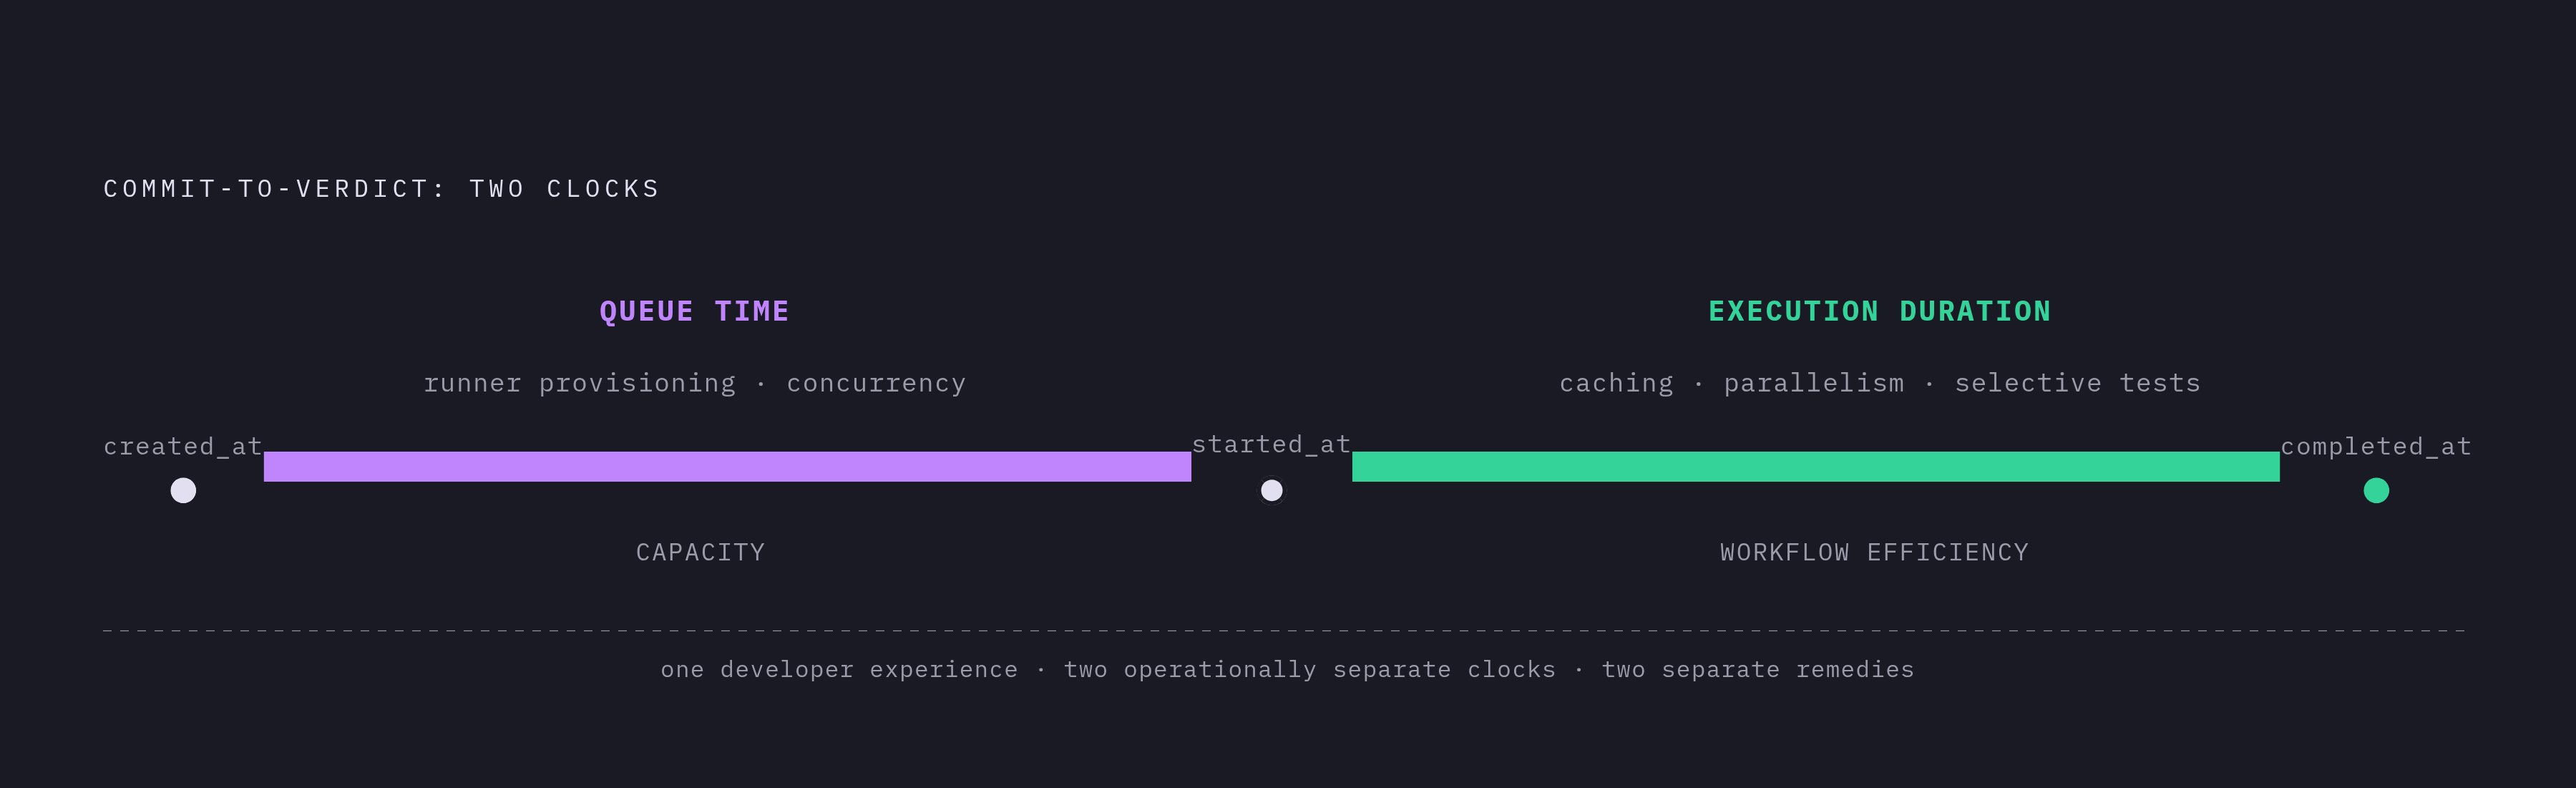
A developer pushes a commit and waits for a required check. The wait feels like one continuous delay. Operationally, however, it contains two clocks, namely the time a job waits for a runner and the time it spends running on one. Workflow tuning targets the second clock, while runner availability governs the first.
Queue time measures the interval before a job starts. Execution duration runs from its started_at timestamp to its completed_at timestamp, which the GitHub workflow jobs API exposes separately. These numbers can diverge without an obvious change in the developer’s experience. Shorter execution may leave the dominant queue delay untouched. GitHub does not bill queue time, but the team still pays for it in idle engineer minutes that never appear on the invoice.
What to measure before touching a single workflow file
To set the baseline, start with real workflow data. GitHub’s Actions Insights tab is the cheapest place to start. It shows average run time and job failures per workflow, plus average run time, average queue time, and job failures per job. No instrumentation is required for this initial view. Use it to find the workflows and jobs that need a closer look at their timings before changing their configuration.
For per-job precision, obtain the timestamps from the workflow jobs API. It exposes created_at, started_at, and completed_at, together with step-level timings and runner metadata. Calculate queue time per job as started_at minus created_at. Calculate execution duration per job as completed_at minus started_at. Keep both values attached to the same job so that a long wait is not mistaken for a long build.
Record p90 or p95. Averages flatten the spikes behind the worst waits. Read queue time and execution duration together, because a slow pipeline can have more than one cause. Record the workflow configuration in place when those measurements were taken, including compliance gaps that may affect the baseline. A written baseline gives leadership something to compare later results with to see whether a change made feedback better or just changed the workflow.
How to read the baseline: separating a capacity problem from a build problem
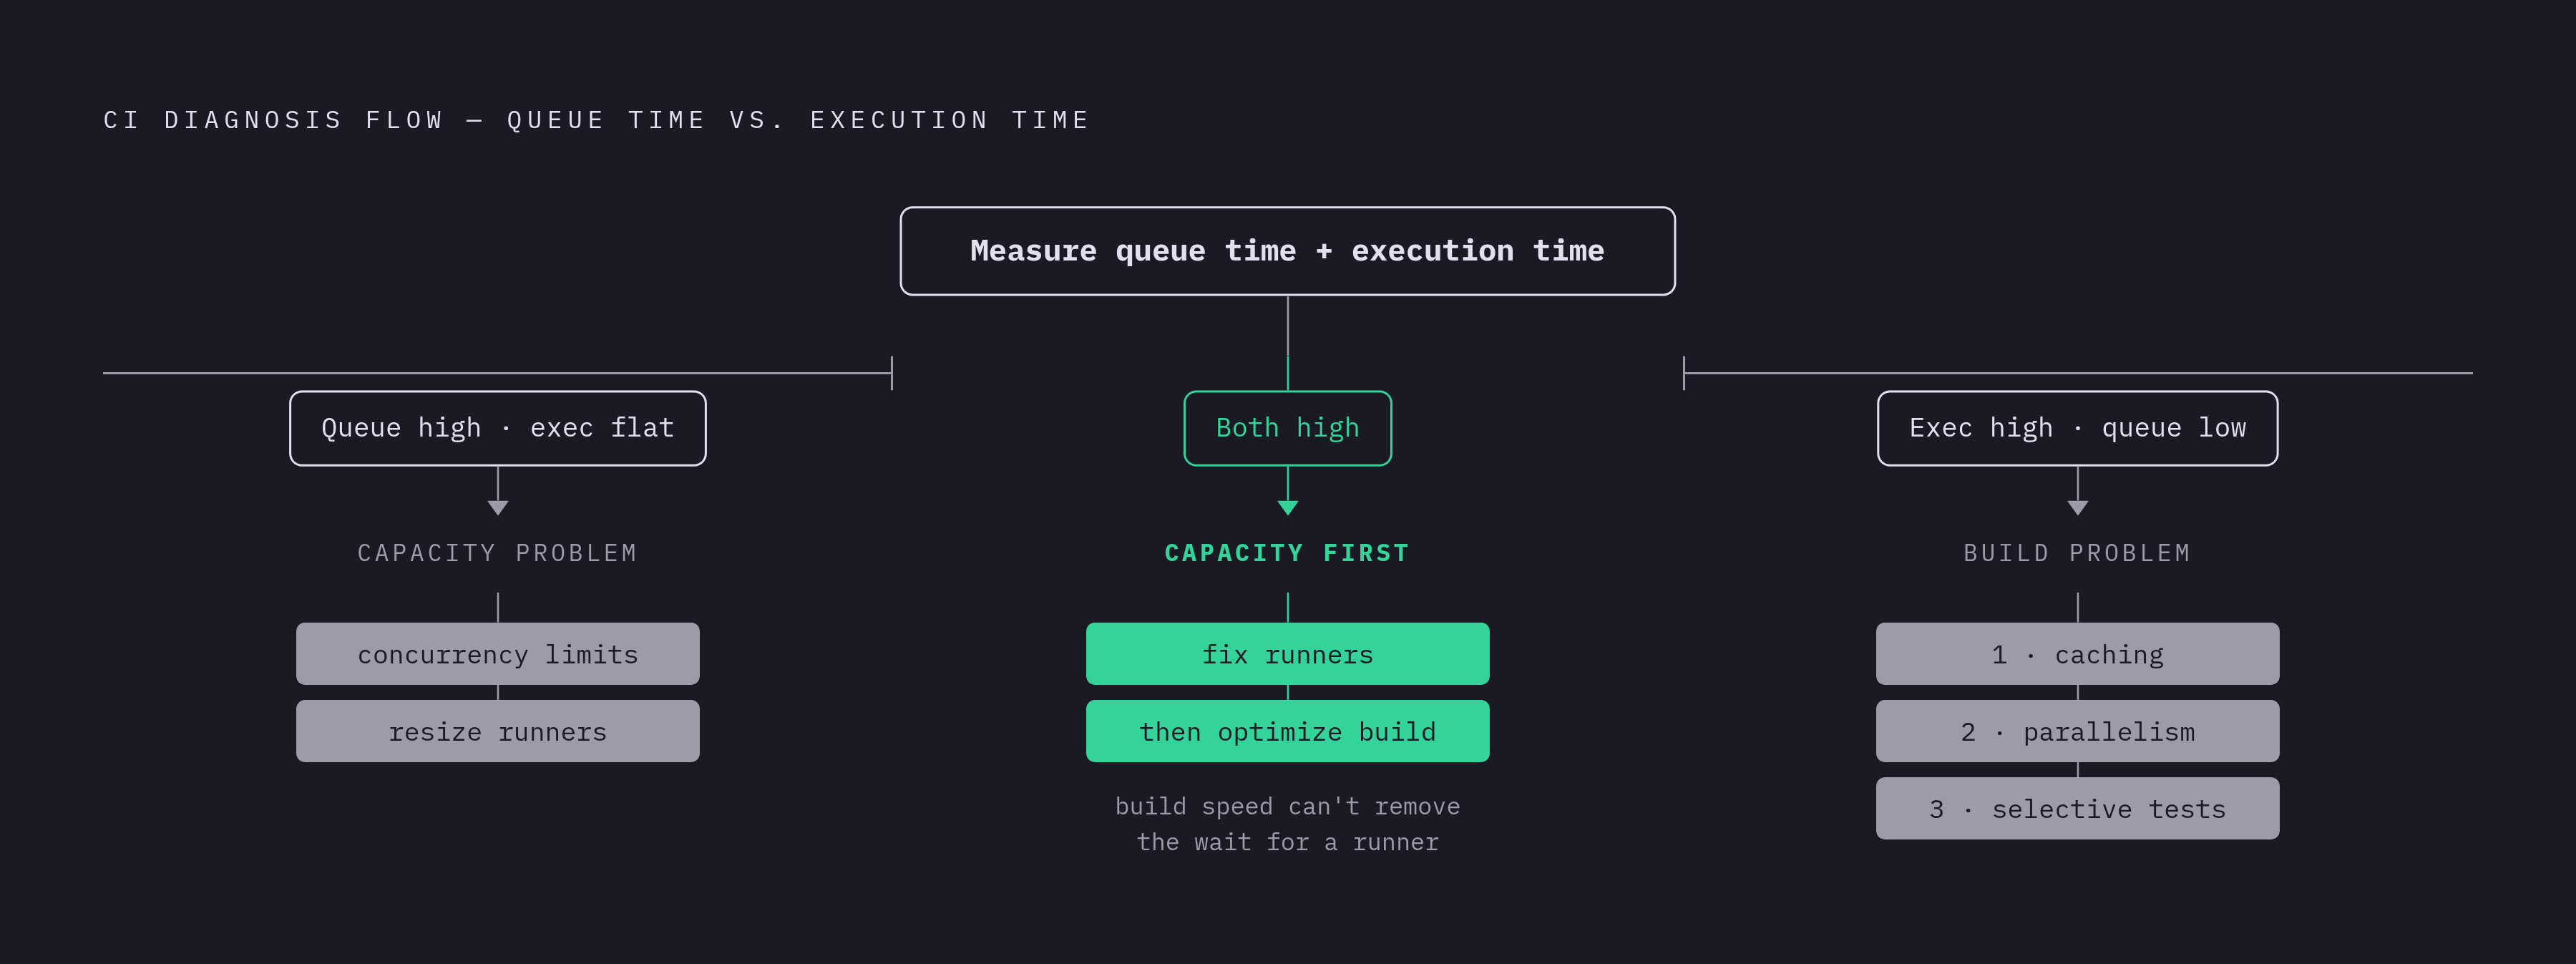
The baseline becomes useful when it determines the next action. If queue time is high while execution stays flat, capacity is the main problem. If execution is high while queue time stays low, the dominant problem is the build. If both are high, both require attention. Address capacity first in that case, because build optimization cannot remove the wait for a runner.
This distinction separates interventions that are often discussed together. Runner provisioning and concurrency settings address capacity, while caching, parallelism, and selective testing address execution. The remedy must match the measured delay. Using either fix without first checking the cause can cost time and money while leaving the developer’s main delay in place.
GitHub’s 2026 Actions security roadmap, announced March 26, 2026, introduced workflow-level dependency locking, scoped secrets, an Actions data stream, and a native egress firewall for GitHub-hosted runners. With these controls in place, jobs take measurably longer to start. Teams adopting them should re-establish the baseline once the new controls are stable. Otherwise, duration comparisons can mix a build change with a change in the security configuration.
Fixing a build problem: caching and parallelism as the first levers
For a build problem, caching is the first intervention because it offers high yield with low risk. The setup actions use the lockfile hash to make the cache key. Node.js uses actions/setup-node@v7 with cache: 'npm', while Python uses actions/setup-python@v7 with cache: 'pip'. Go uses actions/setup-go@v5, where caching is enabled by default and cache: true is optional. These are small configuration changes.
Cache configuration still needs to support reuse across commits. A key based purely on the commit SHA, without a restore-keys fallback, produces a zero hit rate on every commit. The cache exists but does not serve the next change. A fallback restores the nearest prior cache when the exact key misses, reducing cold-install time. The baseline’s step timings help show how much of a long-running job is spent on dependency installation and how much is spent on other work.
Parallelism is the next lever when independent work runs sequentially. Running lint, typecheck, and test jobs together reduces wall time from their combined duration to roughly the duration of the slowest job. The billing benefit is a different question. GitHub bills per job-minute, so parallel jobs use the same compute budget even though the required checks finish sooner. The gain is faster feedback.
For a test suite that dominates execution, sharding applies the same principle within the suite. Tests are distributed across multiple runners in parallel, with similar total compute consumption and feedback time falling proportionally to the number of shards. Actual workflow structure still needs examination. An Empirical Study of Complexity, Heterogeneity, and Compliance of GitHub Actions Workflows found that build-without-test patterns are common in real-world workflows. That finding suggests teams should check how their workflows are built, but the team’s baseline must show whether parallelism would help.
Selective testing: preserving the verdict while reducing the work
Selective testing reduces how much work runs by skipping tests that cannot be reached by a change while still failing the job when a reachable test fails. The correctness requirement is therefore central to the optimization. A shorter run is useful only if the selection preserves the verdict on the affected behavior.
The dorny/paths-filter action conditionally runs workflow steps according to files changed in a pull request or push. Its v4.0.3 release was released on 2026-08-05. GitHub’s built-in path filters operate only at the workflow-trigger level and cannot suppress individual jobs or steps. Monorepos have a dependency-aware option in Turborepo’s --affected flag. It runs tasks in changed packages and packages that depend on them, following the dependency graph.
Changes to a base image, shared library, or CI configuration must fall back to a full run. That fallback belongs in the implementation. Some engineering leads rule out selective testing for agent-written PRs because their changes can reach parts of the code that are easy to miss. That is a reasonable position for high-consequence paths, provided the decision also acknowledges the feedback latency of running the full suite.
Fixing a capacity problem: when the queue is the dominant clock
When queue wait dominates, execution tuning leaves the main bottleneck in place. Caching can shorten the work after a runner starts, but it cannot shorten the wait for that runner. Test sharding does not solve availability either. On GitHub-hosted runners, queue time depends on platform load and concurrency limits. The capacity track therefore requires a different set of decisions from the execution track.
The available levers include increasing concurrency limits, using larger GitHub-hosted runners, and moving jobs to external runner infrastructure with dedicated capacity. Larger hosted runners have different queue characteristics from standard runners. That distinction needs measurement. Runner choice can affect execution speed as well as availability, so a migration must be assessed against both clocks. Otherwise, faster execution can hide a queue wait that has stayed the same, or a shorter queue can hide a build that still takes just as long.
Capacity can also be consumed by jobs that run too long. The empirical study found widespread compliance gaps, including missing timeouts, unpinned actions, and absent permission scopes. A missing timeout has a direct capacity consequence. A job can hold a runner slot for up to six hours under GitHub’s 360-minute default, increasing effective queue time for other jobs.
Larger hosted runners or third-party providers can cut execution duration directly, while a pool of the right size can cut effective queue time. These effects are distinct, even when one migration produces both. After migration, use the same measurement protocol to establish which clock changed and whether commit-to-verdict time improved. Infrastructure should be credited for the improvement the data shows.
Why agent-written code volume makes the measurement discipline non-negotiable
Coding agents can produce commits continuously. That cadence can sustain queue pressure instead of allowing it to subside between bursts of work. Both clocks then accumulate under sustained load. A pipeline that appears adequate for manual development may expose its delays more clearly when agent commits keep arriving. The measurement discipline becomes more urgent because slow feedback interferes with the iteration cycle that agents are intended to accelerate.
CI applies the same rules to every change without depending on a model’s explanation or a developer’s trust in its output. To be trusted, it must close the feedback loop before the next agent commit arrives. Instructions alone cannot provide the same constraint. Rule files such as AGENTS.md can shape behavior, but LLM compliance is probabilistic. The CI check is the enforceable gate, so its speed and integrity must be considered together.
GitHub’s guidance on reviewing agent PRs says to check CI configuration changes before application code. That review includes workflows, test configurations, coverage settings, and build scripts. An agent that weakens the checks on its own work can get past downstream gates even when those checks finish quickly. Optimizing feedback is therefore not permission to accept a less demanding verdict.
Graphide review provides complementary scrutiny for agent PRs. It shows changed behavior and findings, and says for each how it is known, including when a finding could not be verified. Review does not block merging on its own. Review has a different role from the enforceable CI check, and the engineering team is still responsible for that check’s configuration and feedback time.
The order of operations: a repeatable framework from baseline to fix
The process starts with a per-job baseline recorded from Actions Insights or the workflow jobs API. Record p90 queue time and execution duration, then classify the dominant delay as capacity or build. If both are high, address capacity first. For a build problem, fix caching before trying parallelism, then consider selective testing with a full-run fallback built in for shared-infrastructure changes.
For a capacity problem, assess concurrency limits and runner sizing before evaluating migration. After the change, use the same protocol to compare queue time and execution duration against the baseline and the expected changes. If the 2026 security controls were adopted in the meantime, establish a stable baseline under that configuration before comparing. This keeps a platform change from being mistaken for the effect of the intervention.
The final decision is whether the measured result justifies the change. A shorter execution time is not evidence that a capacity problem has been solved, just as a shorter queue does not establish that the build is efficient. Keep that distinction visible in the comparison. The method applies whether humans or agents write most of the code, but agent-driven development tolerates a slow or broken feedback loop less well. Continuous code production makes disciplined measurement an investment in a verdict the team can receive in time to use.